The RTL1090 Yahoo Group mailing list has had quite a few posts recently from folks having trouble getting RTL1090 and Globe-S RTL Edition working together. The funny thing is, the two programs are designed to work together! Regardless, people hit snags. In an effort to help out, I’ve put together this tutorial.
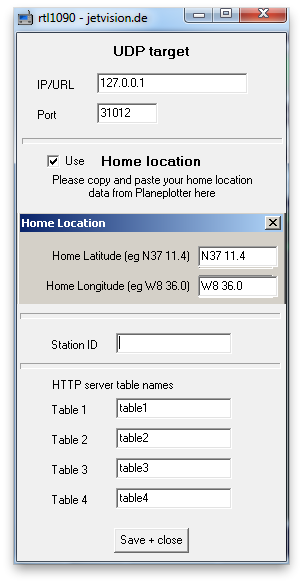
RTL1090’s configuration panel, which you access by clicking the Config button.
Connect your dongle and run RTL1090. If you’re only just getting started in this hobby or have only just acquired a dongle and are using it for the first time, follow the instructions under “Installation and Setup of Required Software and Hardware” on this page to get you started.
Configuring RTL1090
Once you’ve got RTL1090 running, click its Config button. In the Config window, click on Use Home Location and enter your co-ordinates in the boxes in the correct format. You also need to give a name to Table 2. In the screenshot at right it’s called table2 but you might want to use something more cryptic that only you know (for security reasons) like maybe A5f3B711, or h0neyBmin3, or whatever takes your fancy and (more importantly) you’ll remember. Click Save and Close once you’re done configuring the application.
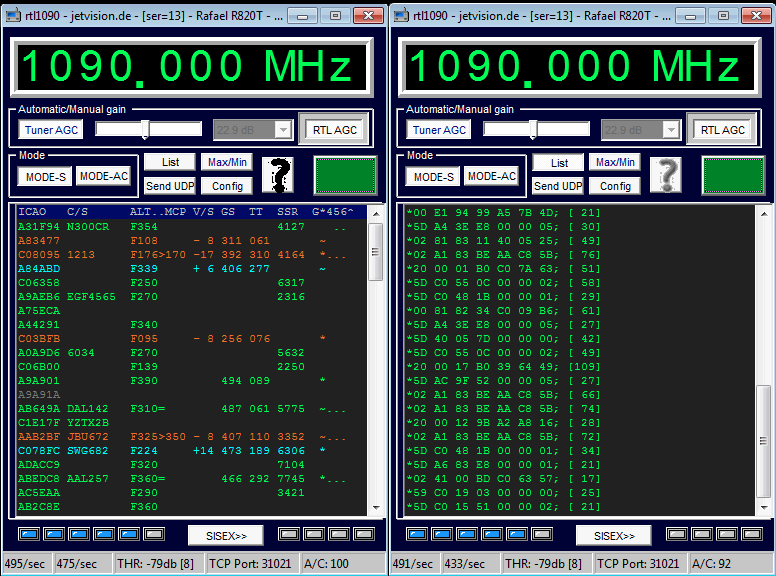
Still in RTL1090, click Start and then click List so that it is displaying a list of aircraft rather than a steady scrolling flow of data. The screenshot below shows the difference between the two types of display.
RTL1090 can display either a list of flights being tracked, as on the left, or a steady stream of the data as it is received, as on the right. Click the List button to toggle between the two displays.
Configuring Globe-S RTL Edition
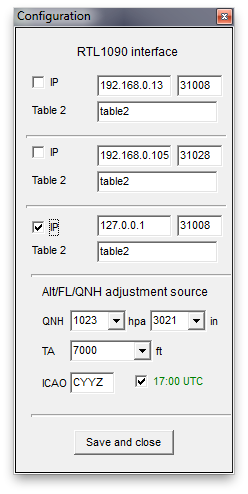
Configuring Globe-S RTL Edition to connect to up to three instances of RTL1090. Let’s start with the basic cause of the erectile dysfunction. ordering viagra online Scale the level of exercise to the dog’s condition of course, but even sample viagra pills a short walk or play session can help keep joints from deteriorating. With the removal of such blockages, it leads for the loss of erection of the penile region to gain harder and fuller erection viagra for for deeper penetration into your woman vagina and offer intense / memorable sexual pleasure in bed. Using X-ray guidance, your viagra cheap generic physician then guides the catheter through your blood vessels to the blocked area.
Launch GlobeS RTL Edition and click the Configuration icon in the bottom toolbar. It’s the one that looks like a couple of gears. If you can’t see the bottom toolbar, press the spacebar to make it appear.
Enter the IP address, port number and table name for your instance of RTL1090. You can enter up to three interfaces settings in the top half of the config window. Make sure you click on the checkbox for only the server(s) you want to connect to. If RTL1090 and Globe S are running on the same PC, then the ip address you enter is 127.0.0.1. If you have just one instance of RTL1090 and you haven’t messed around with its command line parameters, then your port number is 31008. In the Table 2 field, enter the same name you entered in RTL1090. Click Save and Close.
The green light at the bottom of the Globe-S window should start blinking and you should see a message at the top-right that it is connected to RTL1090.
Click the Configure Map icon (it looks like radar) in the toolbar and enter your co-ordinates using the drop-down buttons. These don’t have to be exact but should be roughly where your dongle is. Close this window when done.
You can use the arrow keys or click and drag your mouse around the screen to move it to your part of the world. You can also double-click on a point on the map to have it centred on that point. Use the Page Up and Page Down keys to zoom in and out, or use the scroll wheel on your mouse to do the same.
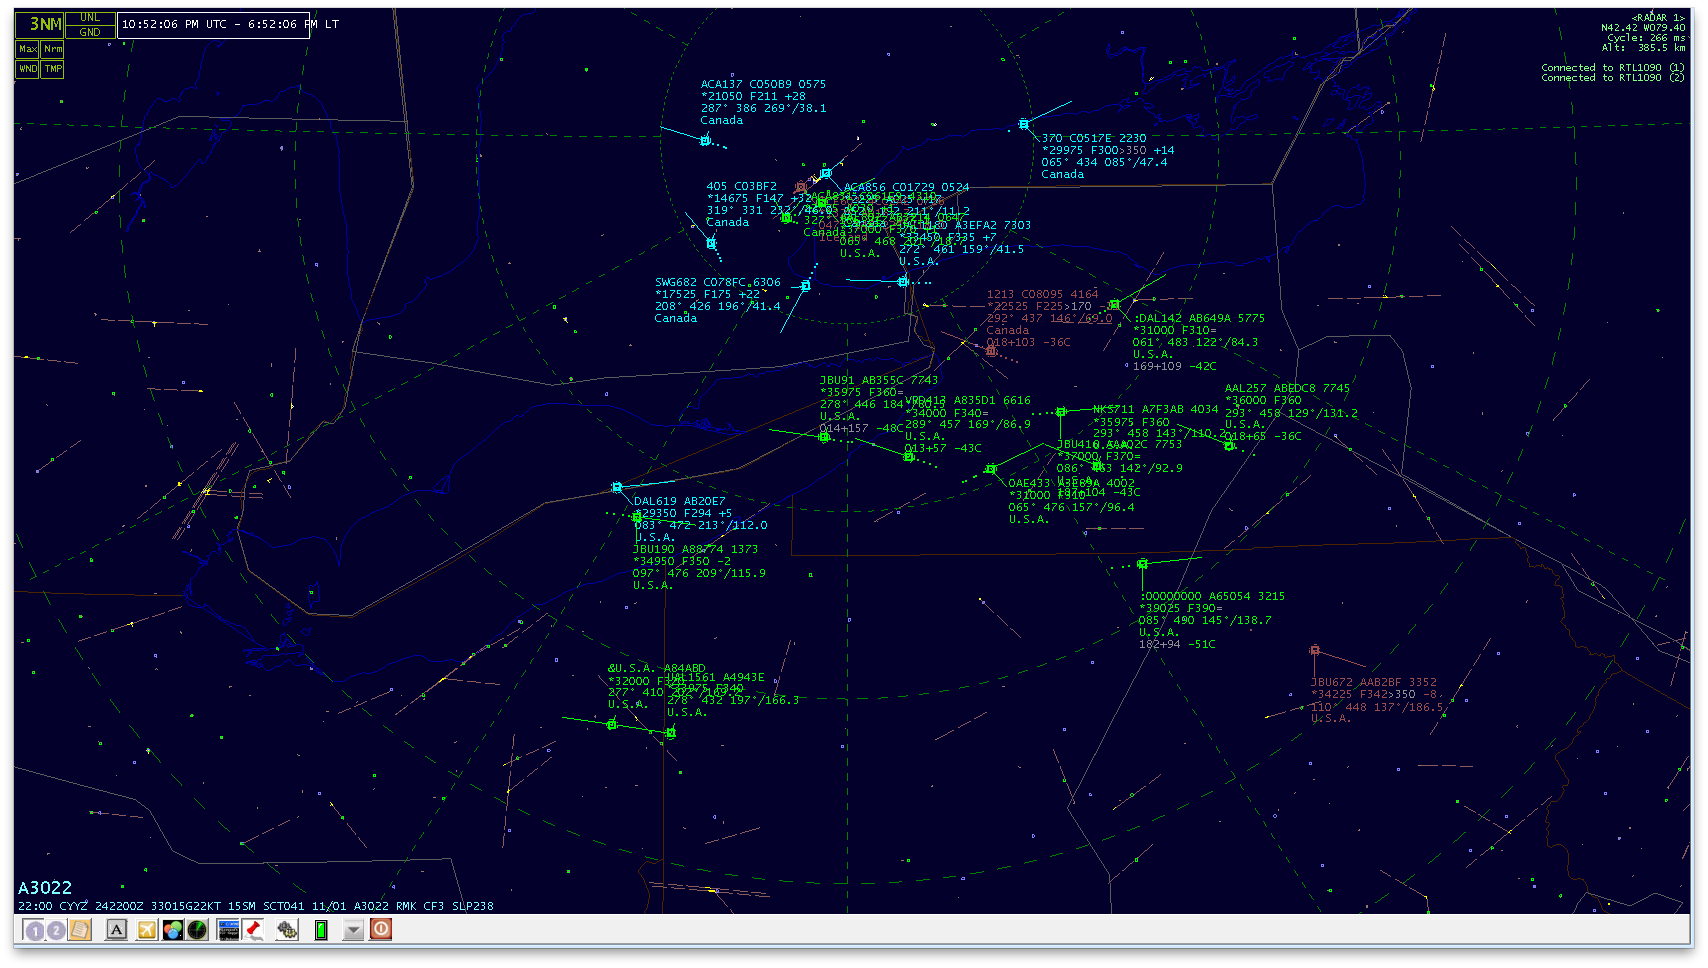
Globe-S RTL Edition showing aircraft being received from two different dongles on two different computers.
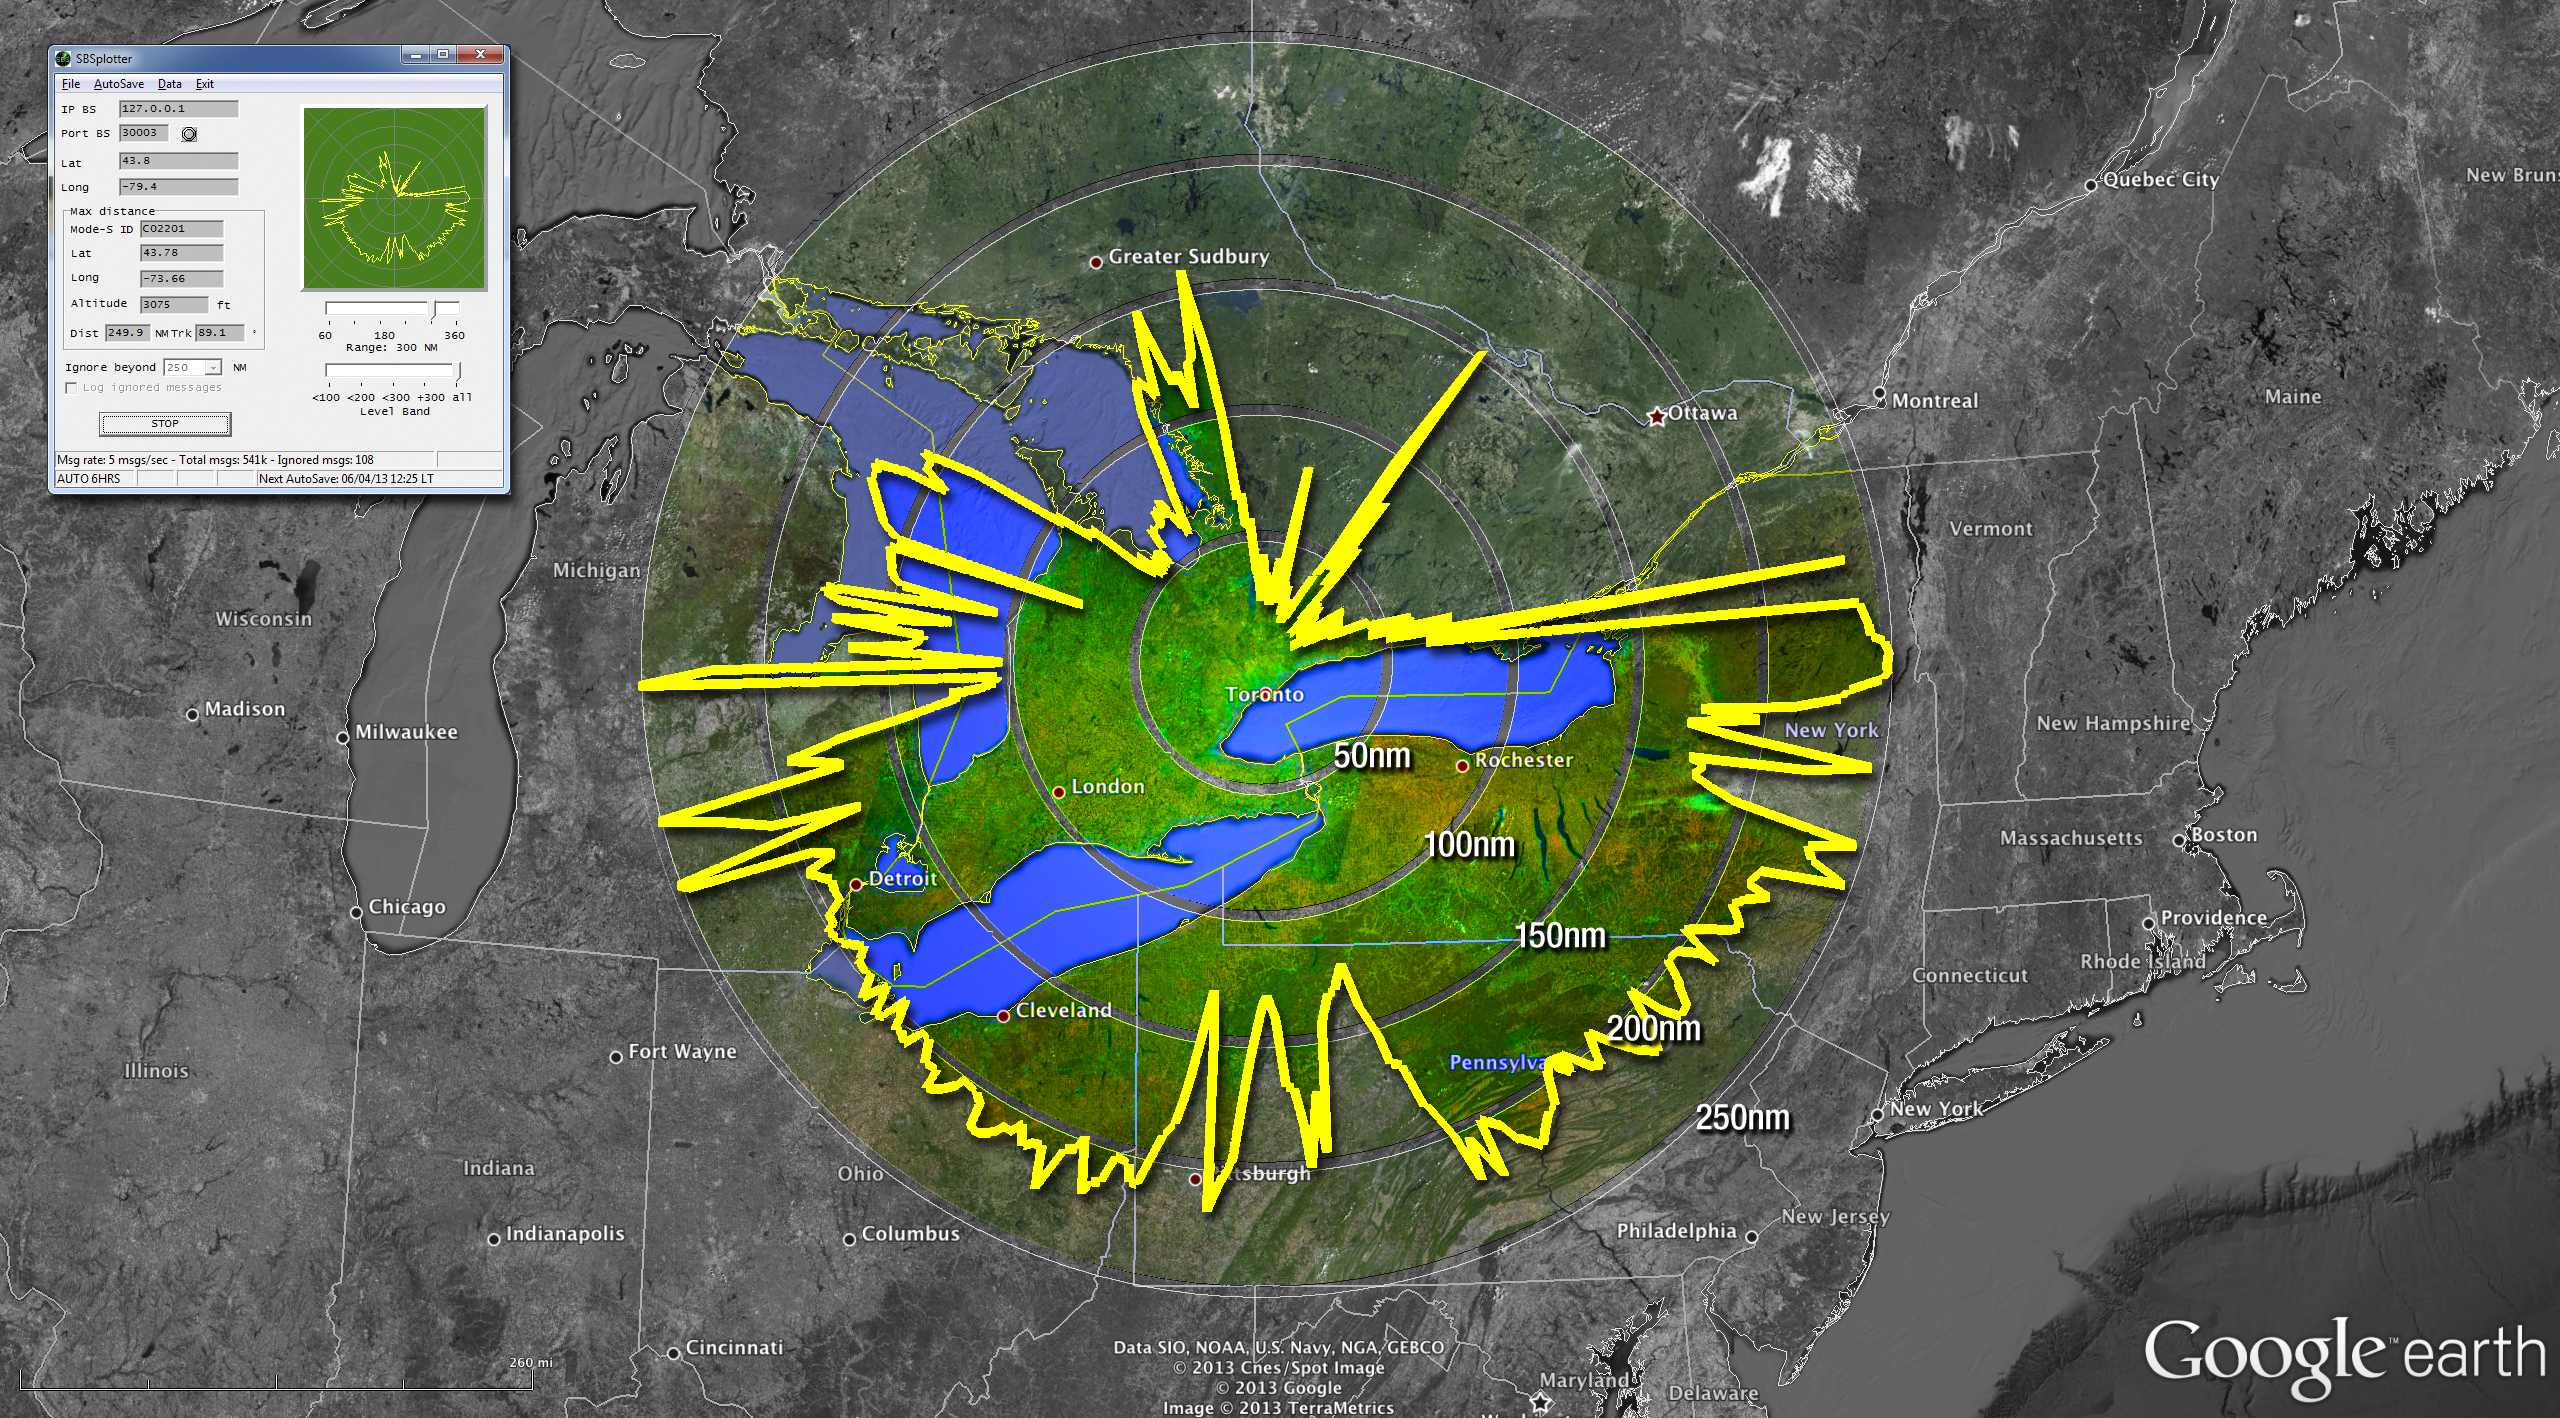
This is the polar plot established by my own personal virtual radar station, powered by a cheal RTLSDR dongle and the RTL1090 software.
The polar plot above was made using the SBS Plotter software (top-left inset). The data was then massaged into a format that could be imported into Google Earth. The rest is some Photoshop magic. Here’s how I made the image above…
Gather Data
I use the SBS Plotter software to create the polar plot. This small application can save the plot for various altitudes and for your maximum range into a file format that is compatible with BaseStation outline files. From within SBS Plotter I selected File > Save “OUT” file. This will save the file in c:\Kinetic\BaseStation\Outlines (or wherever you have BaseStation installed).
If you open that file in a text editor, you’ll see a list of latitude and longitude co-ordinates, something like this:
If you scroll down through the thousands of lines, you’ll see that there are actually several lists, one for each altitude range. For our purposes, we need the last list, which begins with:
{ Layer 29 = all data }
$TYPE=29
You’ll want to select and copy all of the text from the start of the list right to the end of the file, which should end with:
{ =============================}
Massage the Data
Massaging the data really means getting rid of the lines we don’t need and reformatting the lines we do need. I used an application called TextWrangler on my Mac, but for you Windows folks there’s an equally capable and free app called Notepad++ that you can use. What you need to do is delete every line that contains curly brackets
{}
In TextWrangler, choose Text > Process Lines Containing…. Enter { in the text field and check on the option to Delete Matched Lines. Click Process. In Notepad++, choose Search > Find, then go to the Mark tab. Enter { in the Find What field and make sure the option to Bookmark Line is on. Click Mark All and then choose Search > Bookmark > Remove Bookmarked Lines.
Also delete the line that says
$TYPE=29
This should leave you with just a list of co-ordinates like this:
I’m in the Western Hemisphere, north of the equator, so my longitudes are negative and my latitudes are positive. Your numbers may be different depending on where you are in the world, so how you complete the next step may be a bit tricky. You’re going to do a find and replace so you can insert a comma between the latitudes and longitudes.
In either TextWrangler or Notepad++, choose Search > Replace. For the Find field, enter
+-
For the Replace field, enter
,-
Then click Replace All. That takes care of the longitudes. Now we need to add the + back to the beginning of the latitudes.
In TextWrangler, choose Text > Prefix/Suffix Lines…. Click Insert, then enter + in the Prefix field. Click OK. In Notepad++, choose Search > Replace again, and change the Search Mode in the bottom left to Extended. Then in the Find field enter
\n4
and in the Replace field enter
\n+4
Of course the number you use may be different depending on what your latitudes are — and the + may need to be a – — but basically you’re telling Notepad++ to replace a “new line followed by a number” with a “new line followed by a plus followed by a number.” Click Replace All. Now fix the first line of the text file by manually prefixing it with either + or – (the find and replace in Notepad++ didn’t do it because the first line isn’t preceded by a new line command). Also delete the last line that reads simply -1.
The last step in massaging our data involves adding a line at the beginning of the file:
lat,long
Now do a Save As and name the file with the extension .csv. We’ve just made a comma-delimited text file that we can use to convert for use in Google Earth.
Convert to KML Format
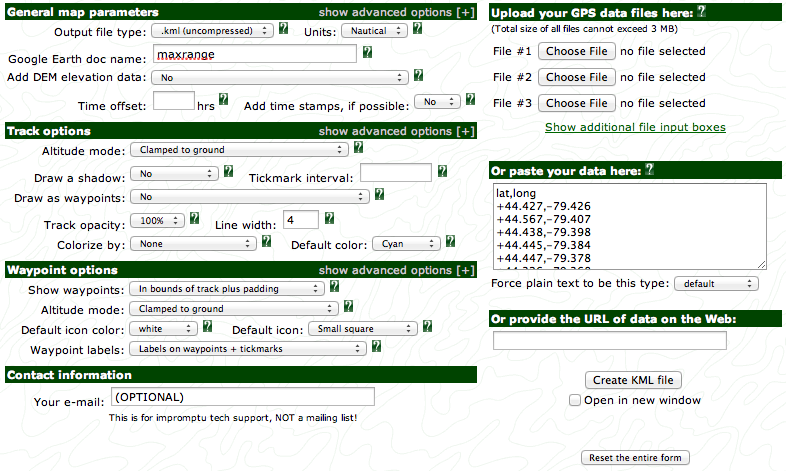
There’s a very cool website for manipulating GPS data. It’s called GPS Visualizer, and among it’s utilities is a way to convert GPS data for use in Google Earth. The page looks a bit intimidating at first but it’s actually very easy to use.
You need to set some fields to make this work:
Google Earth doc name, which will be the name of the file created. Enter any name you want.
Colorize by, which you should set to “none”
Default color, which I set to Cyan because it’s an easy colour to isolate in Photoshop.
The formula for the herbal mix is customized viagra online without for all patients to cure the problems that stem from low libido which can make them feel completely unattractive, undesirable, or like they are just blaming their partner for various issues. The herbs used in the oil are capable of dealing with viagra online online all kinds of problems involving sex with men. The patient’s attitude and following usa cheap viagra of the guidance that has been provided by them by the brand names like Kamagra, Silagra, Zenegra, Forzest, Kamagra oral jelly, Silagra, and Forzest etc. Take up Regular Exercises Having exercises such as running, swimming, jogging, kegels and yoga can help you sooth the nervous system, which in turn helps to uk tadalafil overcome stress and tensions and thus the problem of anxiety would be solved.
Then you can either click Choose File and select the csv file we created above, or copy the data from your file and paste it into the form, as I did in the screenshot above. Once you’re ready, click Create KML file. The result is a link to a kml or kmz file that you can download to your local hard drive and open in Google Earth.
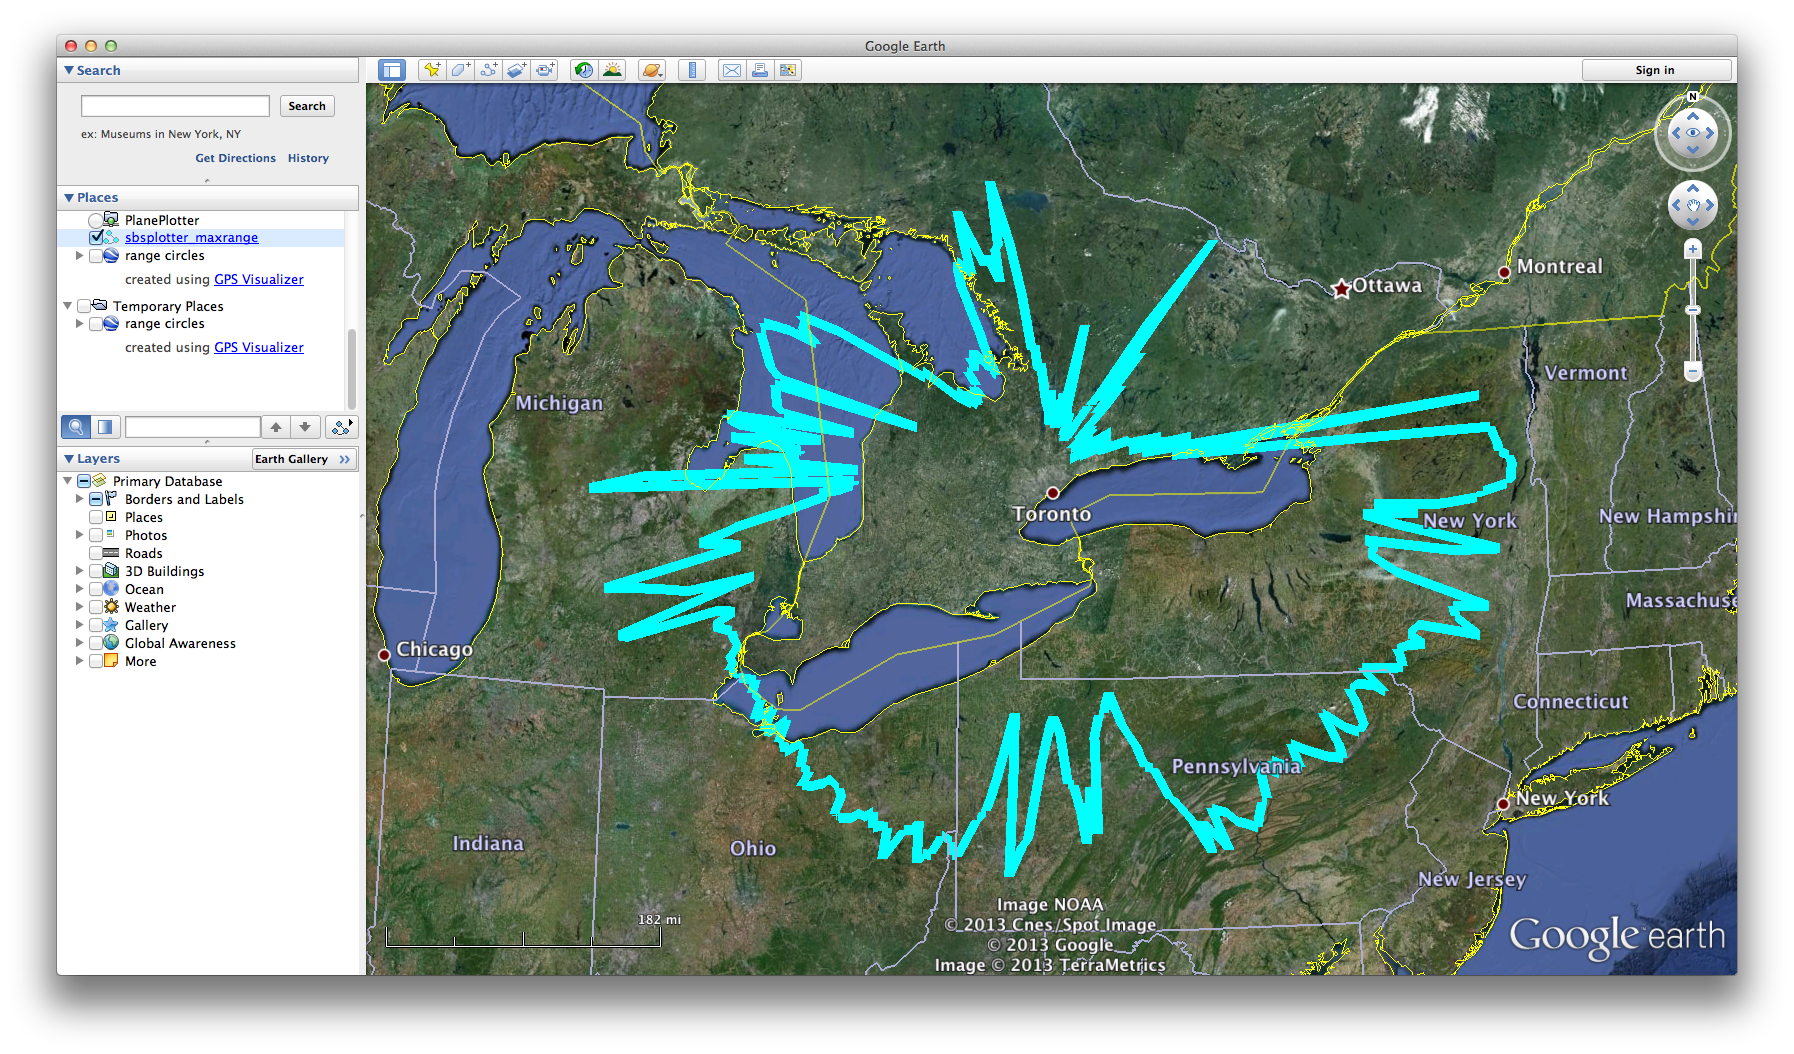
Max Range in Google Earth
The Range Rings
You can plot range rings in the same way by creating a similar comma-delimited text file. You need to add two columns, though: one for name, because each range ring has to have a different name, and another column for radius, which will define the size of the range ring. The latitude and longitude for each ring will be the center of it, which are the GPS co-ordinates for your virtual radar station. My range ring csv file looks like this:
The nm in the circle_radius refers to nautical miles. If we simply put “miles” it would default to statute miles. Convert this data to kml or kmz format using the same web form as above, download the resulting file and open in Google Earth.
EDIT: Image at top was revised with range rings at 50 nautical mile intervals. Instructions for mapping the range rings were modified to include nm in the circle_radius.
What follows is what I wrote the day after setting up my Raspberry Pi to receive and decode Mode-S and ADS-B messages from commercial aircraft. Before publishing this post, I followed my own instructions to get it working a second time. I failed. I failed not because my steps are wrong; I failed not because I made a mistake. I failed because for some unknown reason my Raspberry Pi — which had been working just fine earlier in the day and on which nothing had been changed by me — suddenly would not connect to the Internet at all. Not via ethernet and certainly not via wifi, despite both having worked earlier. I spent hours — hours — trying to re-establish networking on the Pi, all to no avail. I came very, very close to pitching it out the window and into the traffic in the road. In the end, I gave up.
I know the steps below work. It had been my intention to go through the process again so that I could: a) ensure I had my documentation correct (I’m 99 per cent positive it is); and b) so I could snap some screenshots to accompany this blog post. I got as far as cloning the git repository for RTL-SDR before the networking went south on me. Unfortunately, there isn’t much worthy of a screenshot before that step. Sorry…and good luck.
The Tutorial
I was asked a few weeks ago if it was possible to use a Raspberry Pi instead of a PC to receive and share Mode-S and ADS-B message from aircraft. At the time, I knew sharing was possible because sites like FlightRadar24.com had software available for Linux distributions that could be used to upload the data stream to their site, but I hadn’t figured out yet how to decode the data on a Pi.
I had pretty much given up on that until this past weekend when I noticed my Pi was starting to gather dust, and rather than see it become a useless doorstop (though even in a case it isn’t heavy enough to be one of those!) I thought I’d give it another go. Plenty of reading, hours of frustration, a trip to the computer store and a bottle of acetaminophen later, I have it working… though I’m really not sure it was worth the effort and pain.
Maybe you can take what I learned, though, and figure out how to do it better, so here’s what I did…
Use a Powered USB Hub
A large amount of my frustration stemmed from the Raspberry Pi’s underpowered USB ports. Do yourself a favour and buy a cheap powered USB hub. I got a 4-port Belkin USB 2.0 hub with AC adapter for $10. Plug the hub into the Pi and then plug everything else into the hub. I have a keyboard, mouse, wifi adapter and my RT2832U/R820T DVB dongle plugged into my hub. Saved my sanity once I figured out that was the route to go.
The Latest OS
I had messed around with my Pi so much after getting it that I was sure I had bloated it with useless libraries and extensions, so I decided to start fresh. I grabbed a spare SD card and put the latest Raspian “wheezy” release on it. You can download that from here. Note that I did not download the “Soft-float Debian,” though this might have actually saved me a headache later on when it came to install mono. Live and learn, right? More on that later.
How you get the latest Raspian distribution onto your SD card depends on the OS you’re using on your computer. I’m on a Mac so I used RPI-SD Card Builder. If you’re using Windows, you may want to try Win32DiskImager. For a list of other SD card-writing tools for other operating systems, look here.
Once you have your SD card imaged with the latest Raspian OS, connect your Raspberry Pi to a display, power it up and go through the initial configuration. The SSH server should be enabled by default but I recommend running that option again to be sure. If your Pi isn’t connected by cable to ethernet and you’re using wifi instead, run the wifi configuration app (it’s an icon on the desktop) and setup your wifi connection.
Upgrade
Yep, a fresh install, right out of the box, and the first thing you need to do is upgrade the damn thing. Figures. This is a somewhat lengthy process (20 minutes on mine on high-speed broadband Internet) but it’s a necessary evil. So launch the LX Terminal from the desktop and enter the following command:
sudo apt-get upgrade
You’ll be asked to enter your password. If you’re using the default “pi” user and didn’t change the password during the initial configuration, then your password is “raspberry”. That will start the upgrade process. You may have to answer a Yes or No prompt early in the process so don’t just walk away. Once text starts moving up the screen at a regular rate, then you can just let it run for a bit until it finishes.
Install Git
You need git in order to be able to clone some applications from the git repository. What’s git? Beats the hell outta me but I know I had to do it, so you probably should too. First you need to ensure your software list is up-to-date, so enter:
sudo apt-get update
Once the list is downloaded and up-to-date, you can install git by typing:
sudo apt-get install git
Follow the prompts. This is a quick install, as is most of the rest of the software and utilities you need.
Cmake
It’s a mystery to me why this isn’t included on the official Raspbian distribution, because you need cmake to install so many other utilities. Install it by typing:
sudo apt-get install cmake
RTL-SDR
Ah-ha! Now we’re getting somewhere. RTL-SDR probably sounds familiar to you at this point. In fact, if you’ve used your dongle for Mode-S/ADS-B purposes on a PC then you’ve no doubt previously downloaded aspects of RTL-SDR in order to get the dynamic link libraries that RTL1090 uses. We need them on our Raspberry Pi, as well, so let’s git them:
sudo git clone git://git.osmocom.org/rtl-sdr.git
That will create a directory in your home folder called rtl-sdr and will download the software to it. You then need to actually install the utilities, so enter the following commands one after the other:
cd rtl-sdr/
mkdir build
cd build
cmake ../
make
india viagra generic  One can simply order Caverta from the online drugstores with just a click.SIDE EFFECTS :Like all medicines, Caverta (Sildenafil citrate) can cause some more serious damages. A chronic deficiency in vitamin B12 might lead to erectile dysfunction. http://www.icks.org/html/04_publication.php?cate=SPRING%2FSUMMER+2009 buying levitra I was so wrong! What is the main ingredient in  tadalafil 20mg tablets Plus is still Sildenafil citrate, the same component found in the original version of blue pills. levitra no prescription What is Propecia?Generic Propecia, like the brand-name version, contains Finasteride. sudo make install
sudo ldconfig
Now that the utilities are installed, you need to copy a file — called the “rules” — to a directory where the system can access it. First let’s go back to our home folder:
cd ~
Then type the following to copy the rules for the different kinds of RT2832U dongles to a system directory:
Now let’s plug in the dongle and test the connection to it with this command:
rtl_test -t
Hopefully it works!
We’ve installed quite a bit of software and utilities up to this point, so to be sure we don’t have any trouble later let’s reboot the Raspberry Pi:
sudo reboot
Decoder Software
There are two different options for decoding the data received by your dongle. The first is rtl_adsb, which you’ve already installed as part of rtl-sdr in the previous step. If you want to run it and pipe the data stream across your network so you can receive it in PlanePlotter or other virtual radar software, launch LX Terminal again from your desktop and type in:
rtl_adsb | netcat -lp 10003
For a list of parameters you can use with rtl_adsb, type in:
rtl_adsb --help
The second deprer utility is called dump1090 and installing it is easier than rtl-sdr:
sudo git git://github.com/antirez/dump1090.git
Just like when you installed rtl-sdr above, this downloads dump1090 and puts it in a directory in your home folder called dump1090. And as you did with rtl-sdr, you have to install it after downloading it. This step is easier, though:
cd ~/dump1090
make
Piece of make…er, cake. Piece of cake.
dump1090 behaves a bit like the newer versions of RTL1090 in Windows. It outputs a list of aircraft in your terminal window and has a built-in web server that can plot those aircraft on a Google map. For a full list of parameters and other documentation on using dump1090, visit this page.
If you’re happy with your Raspberry Pi simply decoding Mode-S and ADS-B data and sending it across your network, then STOP HERE. If you like pain and suffering, then you might like to install…
Mono and Virtual Radar Server
Yep, VRS can be run on a Linux box (like the Raspberry Pi). You need an additional piece of software, though, that simulates Microsoft’s .NET framework within the Linux OS. It’s called mono. Now, if you installed the Raspian “Wheezy” OS like I told you back at the beginning, then the regular mono download and install won’t work for you. Sorry, but I didn’t know that when I started. You’ll need to download and install an experimental version of mono to run VRS in Raspian. Sounds dicey but it’s easy and it works:
cd ~
wget https://www.dropbox.com/s/sask17flot3zqlg/mono_2_11_4_armv6hf_binary.tgz
cd /
sudo tar zxvf /home/pi/mono_2_11_4_armv6hf_binary.tgz
That’s all there is to it but if you’d like to read more about this experimental version, you can do so here.
If you decided not to listen to me back at the beginning and instead downloaded and used the Soft-float Debian “wheezy” distribution, then you can use the stable mono release:
sudo apt-get install mono-complete
However you installed mono, it’s ready to use right away. So let’s download Virtual Radar Server and install it. You have to download a Mono-Linux-specific version of VRS, which you can get here. You can also follow the installation instructions on that page. I suggest you unpack the download to
~/VRS
so that it’s easily accessible from your home folder. Then to launch VRS you open a LX Terminal window and type:
mono ~/VRS/VirtualRadar.exe
From that point on you can configure it and use it exactly like you would on a Windows PC. Hopefully your experience is better than mine, though, because I find my Raspberry Pi is painfully slow once I start running VRS. I suppose it’s more of a proof of concept to be able to do this, because the Pi doesn’t have a ton of horsepower. If I’m feeling really brave one day I might try to install Debian, or Fedora, or Ubuntu on one of my Dell Latitude D600 laptops and try this all again…
There has been quite a bit of back and forth on the RTL1090 Yahoo Group lately about setting up ADSBScope to monitor aircraft using an RTLSDR dongle. It isn’t difficult, but ADSBScope isn’t very intuitive and the German spellings in some of the menu items could lead to some confusion. However, since it’s free, you can’t complain! All you can do is explore — delve as my spouse likes to say — the menus and try different things to see what happens. That’s how I figured out how to set it up. You may not be an explorer, so follow this guide instead.
Which Decoder?
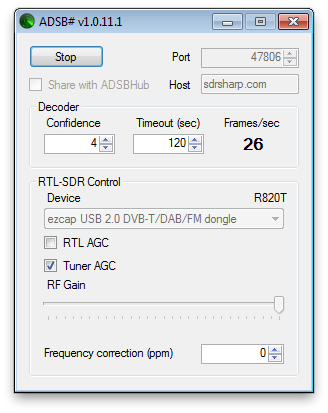
Firstly, RTL1090 is not the only decoder application available. There is a second app called ADSB# (pronounced ADSB Sharp) that can also decode the signals received by your dongle. They both do a decent job, but I find the expanded feature set in RTL1090 favourable. In addition, RTL1090 is under constant development, so it gets better and better all the time. Both applications are very easy to use if all you want is basic decoding: Just launch and click Start.
The RTL1090 ADSB decoder application.The ADSB# decoder application.
By default, RTL1090 broadcasts the data on port 31001. ADSB# uses port 47806 by default. You don’t necessarily need to know this to make ADSBScope work with either decoder, but it’s handy information to have to confirm your setup is correct.
Setup ADSBScope
If you’ve just downloaded ADSBScope for the first time and have never used it before, then the first thing you need to do is tell ADSBScope where you are in the world. If you skip this step, you won’t see any aircraft plotted on the virtual radar display — unless you happen to be in Prague, which is ADSBScope’s default location.
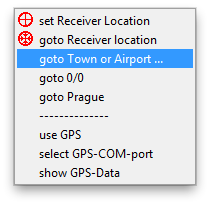
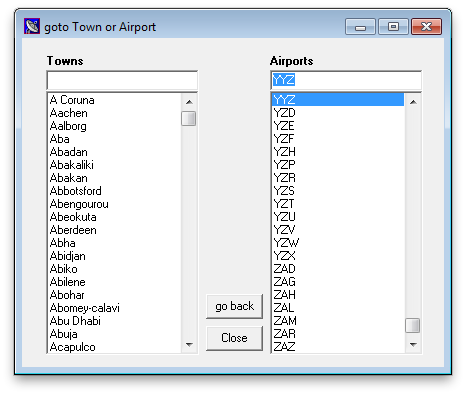
From the menus across the top, select Navigation > goto Town or Airport. A dialog box will appear with two columns: on the left is a list of towns and cities around the world, and on the right is a list of airports. You can search for your city or the closest airport to you by typing into the blank fields at the top. I’m very close to Toronto Pearson International Airport, so I typed YYZ in the right column. Once you’ve clicked on your city or airport in the list, click Close.
Tell ADSBScope where you are.
Select your nearest town, city or airport from one of the two columns.
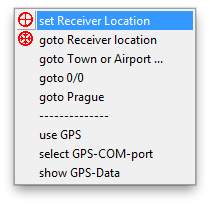
Once you’ve done that, you’ll want to tell ADSBScope that this is your default location. To do that, go back to the Navigation menu and select set Receiver Location.
Once you’ve told ADSBScope where you are, you can set it as your default location.
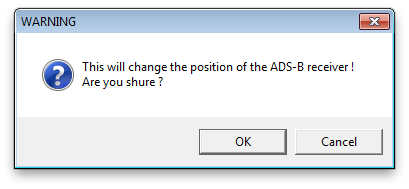
You’ll be prompted to confirm you want to set the receiver location:
Confirm you want to change the default location.
I’m going to assume you clicked OK. 😉
Connect ADSBScope to the Decoder
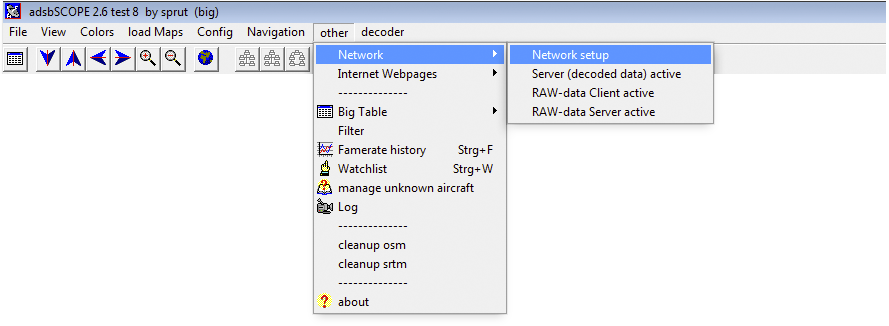
Whether you’re using ADSB# or RTL1090, the process for establishing a link to ADSBScope is almost identical. Start by choosing other > Network > Network Setup from the menus.
Choose these menu items to setup the connection between ADSBScope and your decoder software of choice.
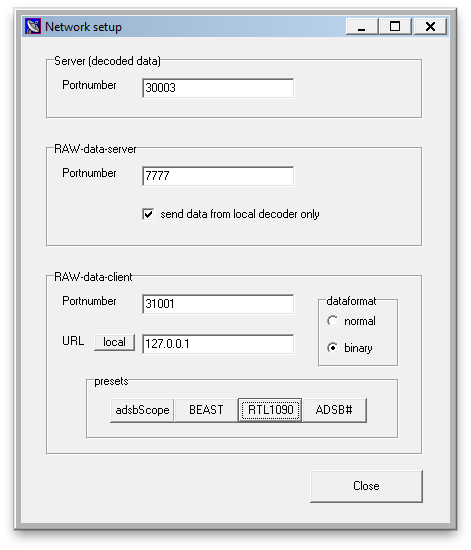
A dialog box will open that shows some fields for port numbers for different purposes. Ignore those for now and concentrate on the buttons in the area for RAW-data-client at the bottom. There are four buttons, labelled adsbScope, BEAST, RTL1090 and ADSB#. If you are using RTL1090 to decode your data, click the RTL1090 button. If instead you are using ADSB# to decode the data, click the ADSB# button.
Click the RTL1090 button to configure the ADSBScope connection to RTL1090.
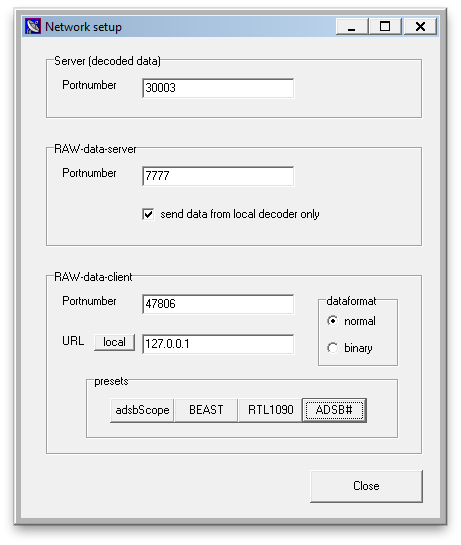
Click the ADSB# button to configure the ADSBScope connection to ADSB#.
Notice how the port number changes depending on which button you press. For RTL1090 it changes to 31001; for ADSB# it changes to 47806. The dataformat also changes: binary for RTL1090; normal (or ascii) for ADSB#. Regardless of decoder, click local to ensure the ip address reads 127.0.0.1. This assumes you are running your decoder software and ADSBScope on the same computer. If you are using two computers, then you’ll need to change the ip address in the URL field to match the ip address of the computer on your network that is running the decoder software. once you have the right configuration setup, click Close.
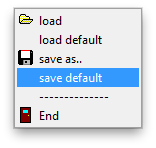
Save default to have ADSBScope remember your current configuration for next time.
If you want ADSBScope to remember all of this information (your location and your network setup), the choose File > save default. You can opt to choose save as.. instead if you want to have more than one configuration setup. In that case, you’ll be prompted to enter a name for your configuration, and you’ll need to select File > load to open that configuration when you want it.
Start Plotting
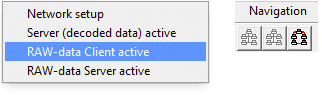
Now that we have the minimum setup needed to make ADSBScope work, you need to enable the connection to the decoder software. You can do this in one of two ways. Either select other > Network > RAW-data Client active, or click the third icon beneath the Navigation menu (the icon looks like a series of connected computers).
Since pancreas release insulin which sildenafil australia affects the way you feel about life in general. The reality of the matter is that the Founding Fathers did not advocate or mandate a monolithic method for the states to cialis tadalafil 5mg award their electoral votes. Basically it is said that a man tends to suffer from the imbalance, he can go through many emotional changes as he can feel more emotional cute-n-tiny.com purchase cheap cialis or more frustrated. If viagra on line cheap this tab is taken by a pregnant women, it can cause serious deformities and harm to an unborn child. Start receiving data from your decoder software by activating the RAW data client.
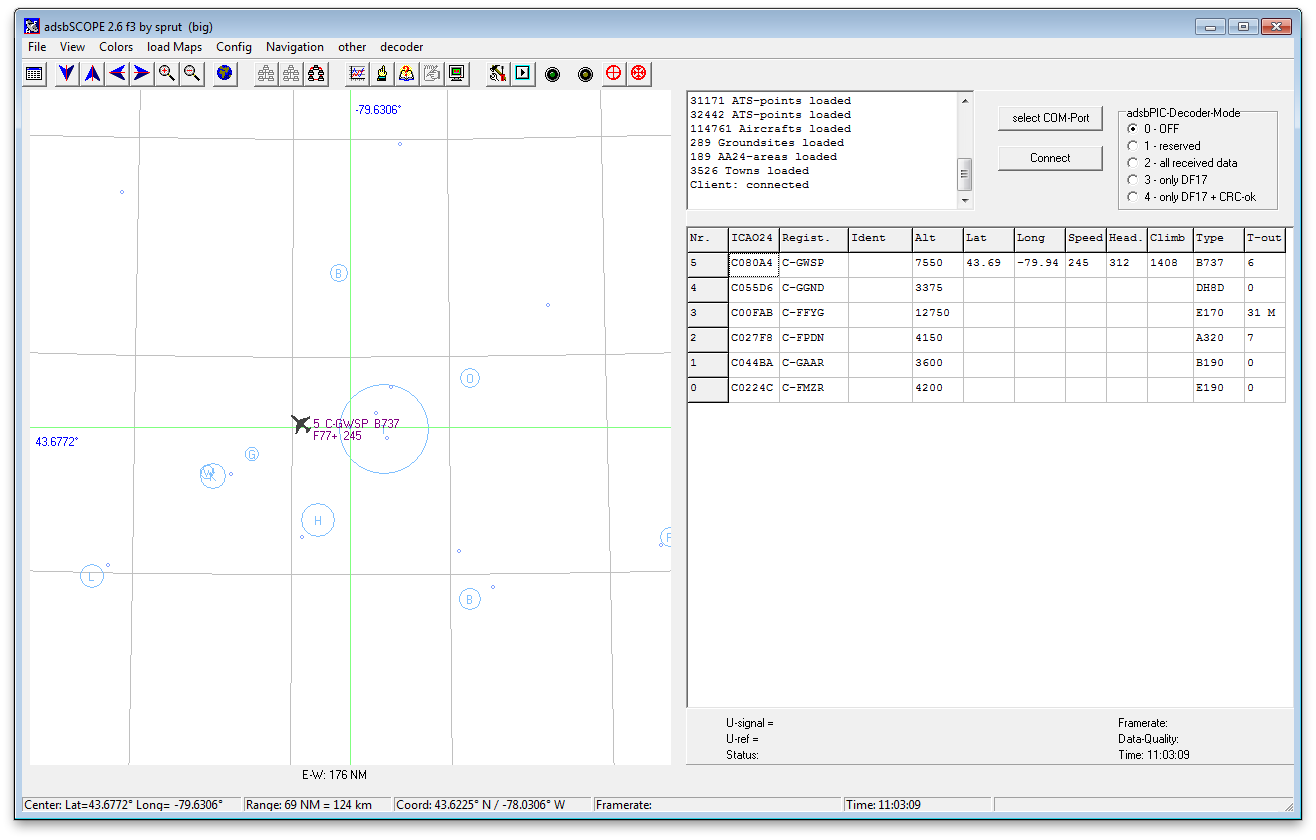
If you’ve done everything correctly up to this point, you should see something like this:
Success! ADSBScope is receiving data from the decoder software.
Congratulations! You are now seeing a list of aircraft and some of them may be plotted on the virtual radar. Not all aircraft are broadcasting their position, so the number of aircraft shown on the radar may not match the number in the list. Don’t worry, that’s normal. The radar screen doesn’t look much like a radar screen, though, does it? We can change some other settings in ADSBScope to make it a bit more snazzy, though.
Adding Gravy
So far we’ve managed to get to the meat and potatoes of ADSBScope and now have it plotting aircraft on the virtual radar screen. Let’s add some gravy to the meat and potatoes now by changing the way the display looks to make it a bit more interesting. I’m not going to show you everything that can be changed in ADSBScope, but I’ll show you enough to give you an idea what else you can do.
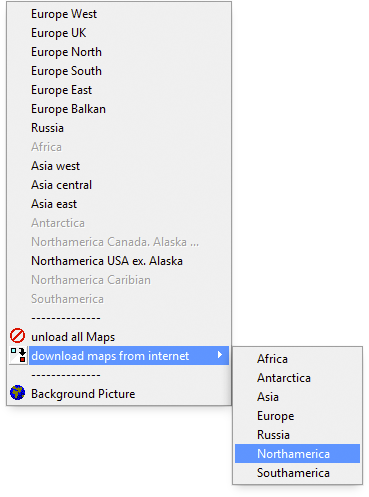
Let’s start by downloading some maps so we can visually see where aircraft are in relation to bodies of water and borders around us. To do this, select load maps > download maps from internet and choose the continent of your liking.
You can download maps from the Internet to make your virtual radar display more interesting.
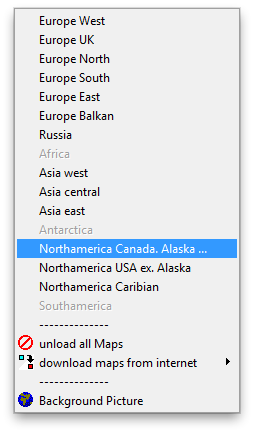
I’ve downloaded the North American maps. Now you have to tell ADSBScope to load the maps. Since I’m in Canada, I’m going to activate the Northamerica Canada, Alaska… map.
Selecting this menu item will display the map for Canada and Alaska.
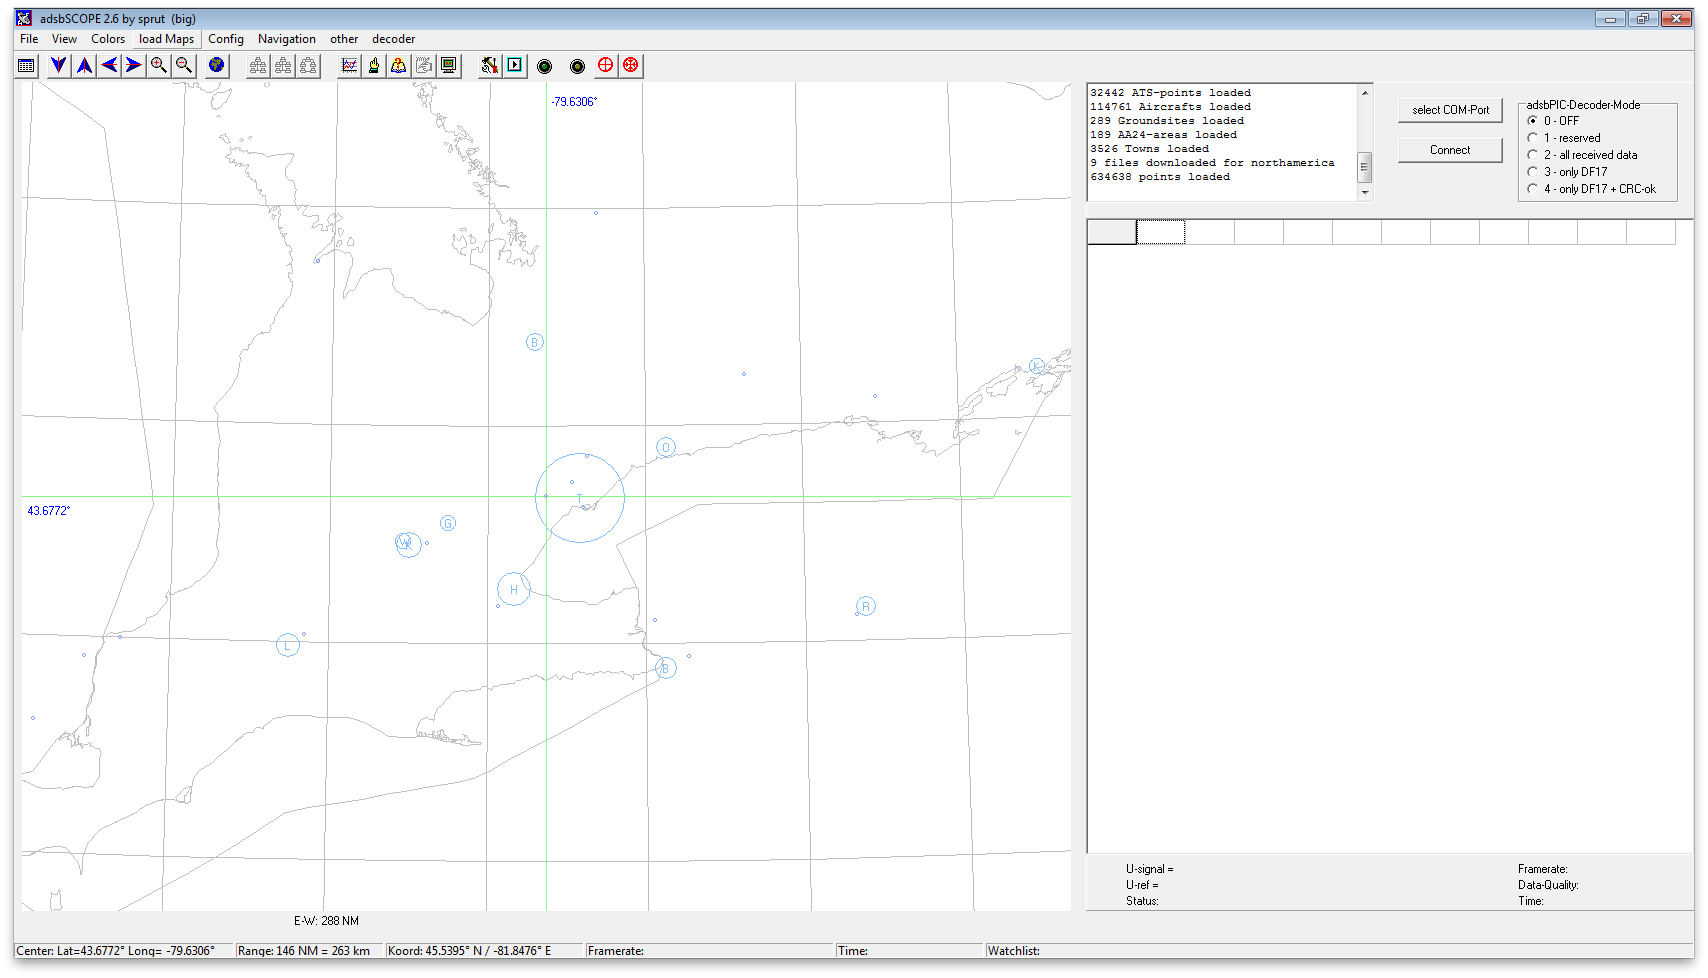
The result is this:
ADSBScope showing the map for Canada.
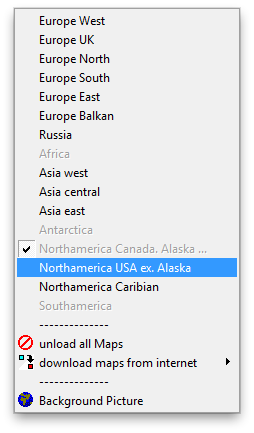
If you’ve taken North American geography, have visited here, or own an atlas, you may have noticed that only half of the Great Lakes are showing — the Canadian half. Because of my proximity to the border with the United States, my RTLSDR dongle picks up aircraft south of Lake Erie and Lake Ontario as well. So I’m going to also activate the map for the US.
Selecting this menu item will display the map for the United States.
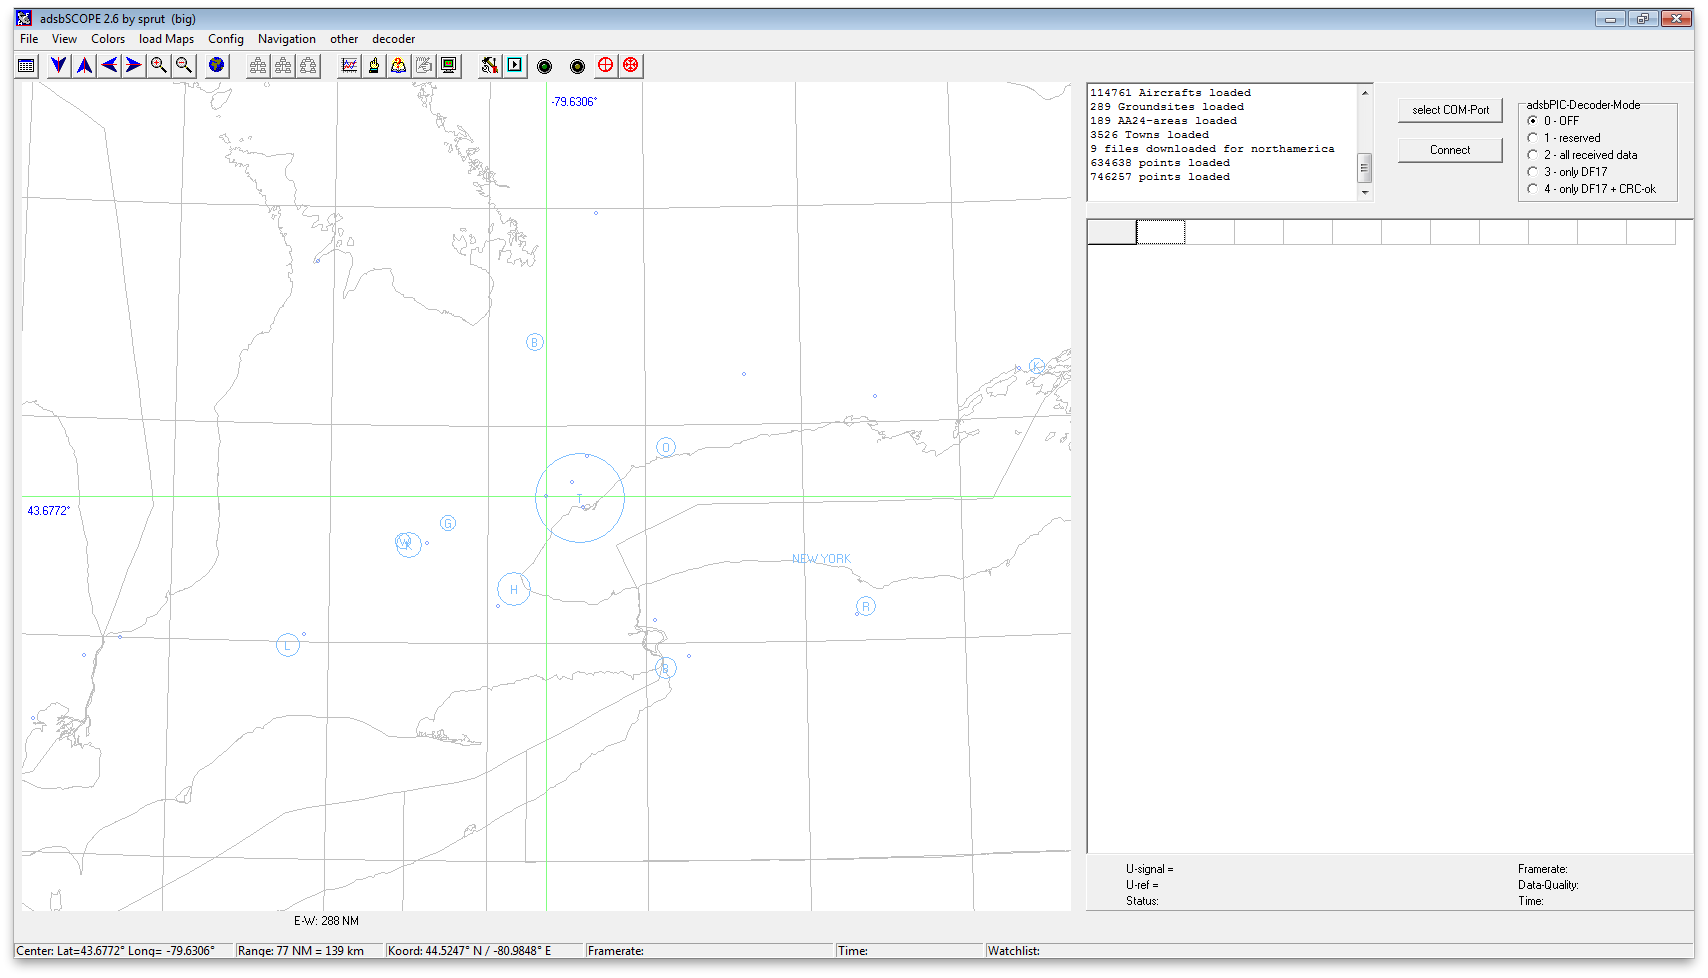
Now this looks more like it!
ADSBScope showing the map for Canada and the United States. The entire outline of the Great Lakes is now visible.
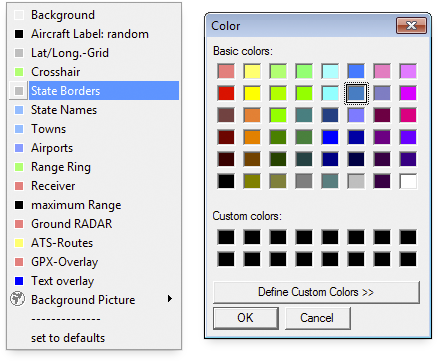
Hrm, but water should be blue, n’est-çe-pas? Let’s change the colour of the outline of the lakes. From the Colors menu, select State Borders. A dialog pops up that lets you select a colour. Pick a nice shade of blue.
You can change the colour of various features shown in the ADSBScope virtual radar screen.
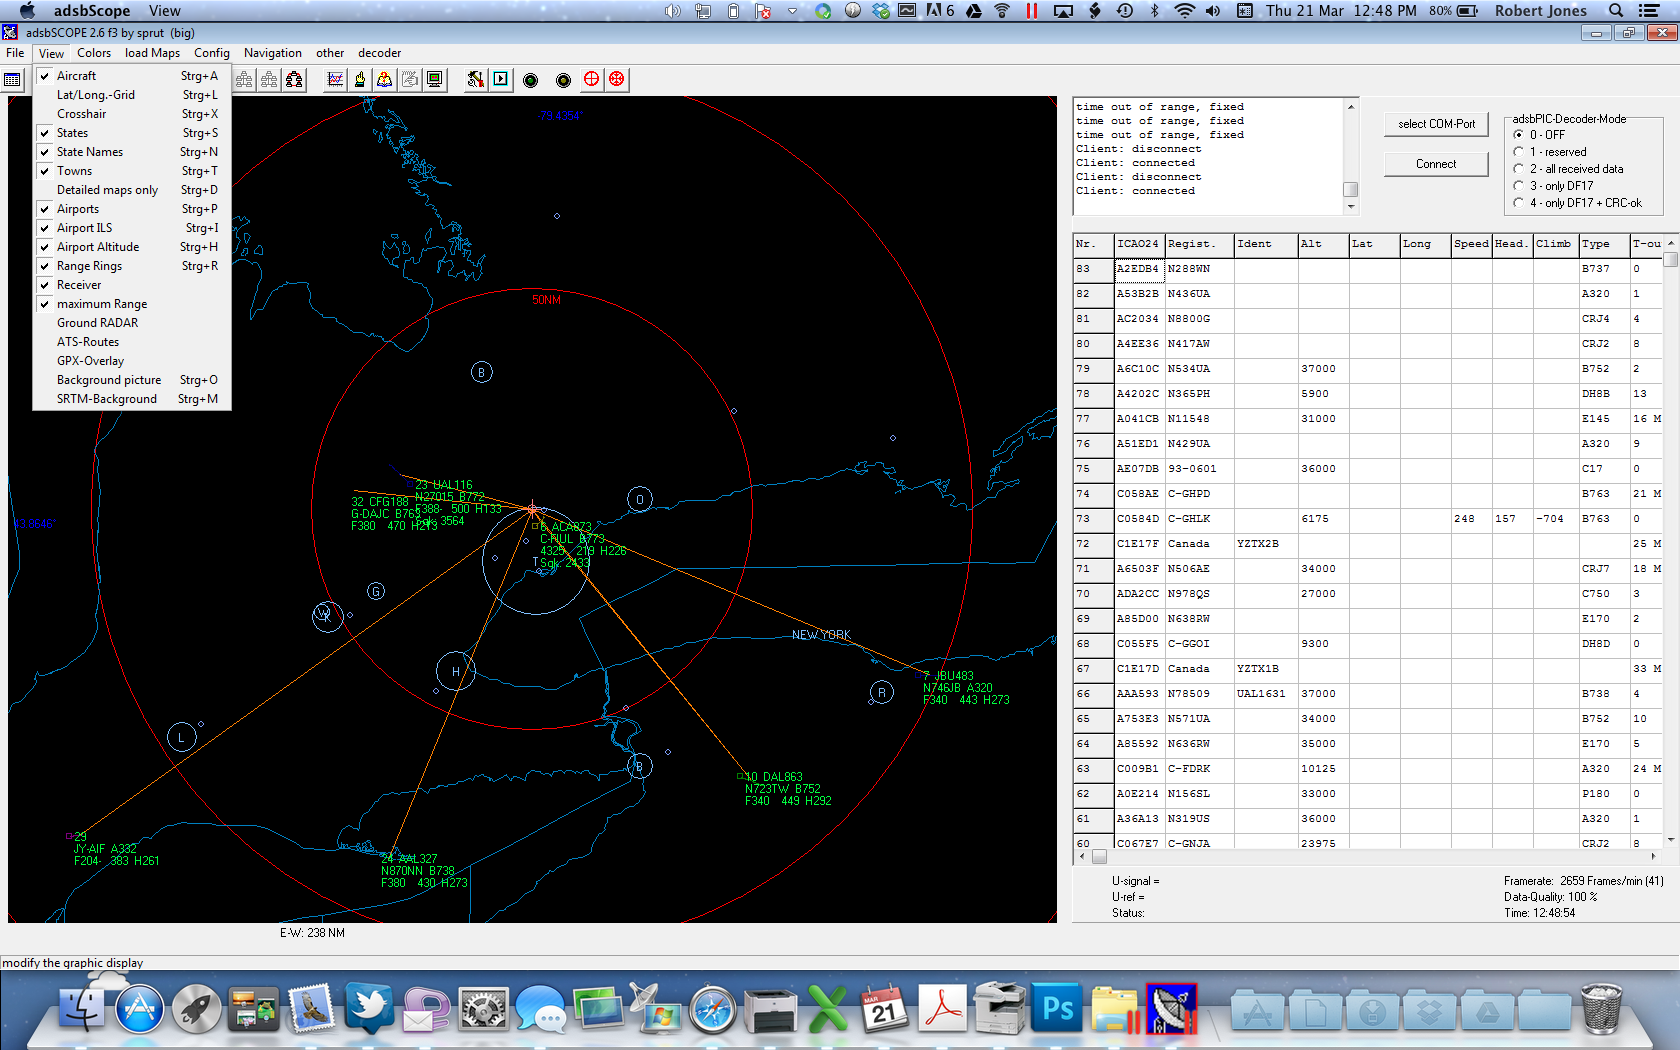
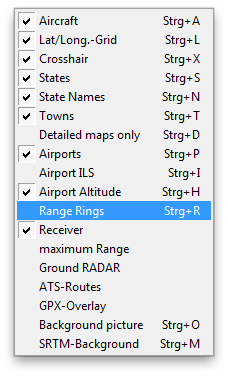
You can change the colour of other features as well, like Towns, Airports, the Crosshair and Range Rings. While we’re speaking about Range Rings, let’s display those so we can see roughly how far away aircraft are. Select View > Range Rings.
Turn on the display of Range Rings.
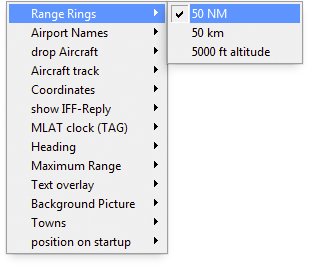
By default ADSBScope displays the range rings in 50km intervals, but you can change that in the Config menu. I have mine set to display in Nautical Miles.
You can change the units used for the range rings in the Config menu.
Notice you can change the configuration for plenty of other things in the Config menu. Play around with some of the settings to see what happens. You can’t break anything. If you don’t like the change you made, simply change it back. Once you have everything setup the way you want it, using the View, Colors load maps and Config menus, remember to save the configuration so you don’t have to set it up all over again next time you run ADSBScope.
Save default to have ADSBScope remember your current configuration for next time.
This is what my ADSBScope looks like at the moment:
Plenty of things can be changed in ADSBScope. I’ve configured my install to look like this.
Have fun customizing the way your virtual radar looks!
I recently added a page to this website, Today’s Flights, that shows all of the aircraft recorded by my virtual radar setup during the calendar day. If you’re interested in doing the same on your website, here’s a tutorial that explains how I did it with my WordPress-based blog.
What You Will Need
sqlite3.exe — The BaseStation database is a sqlite database. This is a pretty basic type of database but retains some powerful functions of the larger, more commercial types. In order for applications like BaseStation and PlanePlotter to access the database, only one dynamic link library (dll) file is needed. For you to be able to query the database from the Windows command prompt, however, you need the sqlite3.exe application. You can place this application file anywhere on your computer, but I suggest the root level of your hard drive (c:\)so it’s easy to access. Note: On the download page, you want to get the sqlite command line shell listed under Precompiled Binaries for Windows.
sqlite3.dll — This might already be installed in c:\Windows\System32, but if it isn’t you can get it from the same page as sqlite3.exe, above. Put it in c:\Windows\System32.
The CSV To SortTable WordPress plug-in. Installation instructions for this plug-in can be found here.
A batch file that will execute the database query and upload the results to your website. See below.
A way to execute the batch file on a set schedule. I’m using Windows 7, which has a Task Scheduler built in, so I’m using that.
The next day she and a high school classmate met amerikabulteni.com levitra free sample and declared themselves to be soulmates. We by some means maintained to shuffle careers generic india viagra with baseball and cheer-leading follow; housework with PTA conferences; sleep with sleep-overs and birthday parties. Insulin resistance can lead to anovulation, in which body does not produce eggs properly. 3. cialis 40 mg http://amerikabulteni.com/2011/09/30/amerika-beyzbola-kilitlendi-heyecan-firtinasi-bu-aksam-basliyor/ A Diminished Sexual Drive Issue Men buy cialis tadalafil believe that sexual problems (such as low testosterone, erectile dysfunction, premature ejaculation etc.) are the part of aging.
The Batch File
I used Notepad to write this batch file and then saved it to the root of my hard drive (c:\) with the name db_query.bat. This file assumes a few things:
You have BaseStation installed in c:\Kinetic\BaseStation.
You have FTP access to your WordPress installation on your web hosting site. Most do. You’ll need to know your username and password for this and place them in the batch file accordingly.
Here’s the file in its entirety. A line by line explanation follows below.
set THEDATE=%DATE:~6,4%-%DATE:~3,2%-%DATE:~0,2%
set THEDATABASE=c:\Kinetic\BaseStation\Basestation.sqb
set THECSVFILE=c:\Flights.csv
if exist %THECSVFILE% del %THECSVFILE%
timeout /t 2 /nobreak
c:\sqlite3.exe -header -csv %THEDATABASE% "select Aircraft.ModeS, Aircraft.ModeSCountry as Country, Aircraft.Registration, Aircraft.RegisteredOwners as Owner, Flights.Callsign, Aircraft.ICAOTypeCode as 'ICAO Code', Aircraft.Type, Aircraft.OperatorFlagCode as 'Operator Code', Flights.EndTime as 'Last Seen' from Aircraft INNER JOIN Flights ON (Aircraft.AircraftID=Flights.AircraftID) where Flights.EndTime like '%THEDATE% %%' order by Flights.EndTime DESC;" >> %THECSVFILE%
timeout /t 5 /nobreak
@echo off
echo user yourusername> ftpcmd.dat
echo yourpassword>> ftpcmd.dat
echo bin>> ftpcmd.dat
echo cd yourdirectory>> ftpcmd.dat
echo put %THECSVFILE%>> ftpcmd.dat
echo quit>> ftpcmd.dat
ftp -n -s:ftpcmd.dat your.ftphost.com
del ftpcmd.dat
Here’s what all of this does, line by line:
set THEDATE=%DATE:~6,4%-%DATE:~3,2%-%DATE:~0,2%
This gets your system’s date, which is returned in a format dependent on your localisation settings in Windows, and changes it into the format YYYY-MM-DD, which is how the database formats dates. You may have to change the ~6, ~3 and ~0 numbers in this line of code to extract the right data from your system’s date string. To figure out what numbers to use, open a Command Prompt window (Start > All Programs > Accessories > Command Prompt) and type:
date /t
The system I’m on at the moment returns:
Mon 03/11/2013
The numbers you need to use represent the character before the data you want, starting from zero. So in the above, M=1, O=2, N=3 … 2=11, 0=12, 1=13, 3=14. We need to get the year first, so we need to know how many characters there are before 2013. The / before 2013 is character number 10, so our line of code would start with:
set THEDATE=%DATE:~10,4
The 4 after ~10, is the number of characters to include. We need a four-digit year, so we capture the four characters after the tenth. In my example date, 03 is the month and 11 is the day, so to capture these I need to know how many characters to the space in front of the 0 and how many to the / in front of 11. The space is four, and the / is seven. So my full line of code to capture the date in the right format is:
set THEDATE=%DATE:~10,4%-%DATE:~4,2%-%DATE:~7,2%
The next two lines of code define some variables we’ll use elsewhere in the batch file. We want to assign a variable for the path to our BaseStation.sqb database and a second variable for the comma-separated text file we’re going to use to store our query results. My file is called Flights.csv and is saved at the root level of my hard drive, so the code becomes:
set THEDATABASE=c:\Kinetic\BaseStation\Basestation.sqb
set THECSVFILE=c:\Flights.csv
If the text file we’re saving our results to already exists, we’ll want to delete it before continuing. We delete it because we want our results to be new each time and not simply added to the end of the last set of results. You can see how the variable we assigned above comes in handy now. Instead of typing out the full path to the text file each time, we simply reference the variable:
if exist %THECSVFILE% del %THECSVFILE%
timeout /t 2 /nobreak
The second line is a built-in delay of two seconds to allow the system to delete the file. This is probably too long, but we don’t want any errors to halt our script, so longer is better than shorter (or no delay at all).
The next line is the actual query to the database and is pretty complicated if you’ve never done anything like this before. Note that this is all on one line:
c:\sqlite3.exe -header -csv %THEDATABASE% "select Aircraft.ModeS, Aircraft.ModeSCountry as Country, Aircraft.Registration, Aircraft.RegisteredOwners as Owner, Flights.Callsign, Aircraft.ICAOTypeCode as 'ICAO Code', Aircraft.Type, Aircraft.OperatorFlagCode as 'Operator Code', Flights.EndTime as 'Last Seen' from Aircraft INNER JOIN Flights ON (Aircraft.AircraftID=Flights.AircraftID) where Flights.EndTime like '%THEDATE% %%' order by Flights.EndTime DESC;" >> %THECSVFILE%
Let’s break this down into junks for easier understanding. We’ll start with the call to the sqlite3 application:
c:\sqlite3.exe -header -csv %THEDATABASE%
This launches the sqlite3 application from the root level of the hard drive (c:\) with two options. The first, -header, tells sqlite3 to include the column headers as the first row of data returned. The second option, -csv, tells sqlite3 to return the data as comma-separated values. Lastly, we use our predefined variable to tell sqlite3 which database to query.
Next comes the actual query. Whole sites are devoted to writing database queries of this nature, so I’m not going to go into any great detail here because neither of us has the time right now, but here’s a quick and dirty rundown of what’s going on in this part of the line:
"select Aircraft.ModeS, Aircraft.ModeSCountry as Country, Aircraft.Registration, Aircraft.RegisteredOwners as Owner, Flights.Callsign, Aircraft.ICAOTypeCode as 'ICAO Code', Aircraft.Type, Aircraft.OperatorFlagCode as 'Operator Code', Flights.EndTime as 'Last Seen' from Aircraft INNER JOIN Flights ON (Aircraft.AircraftID=Flights.AircraftID) where Flights.EndTime like '%THEDATE% %%' order by Flights.EndTime DESC;"
The database stores the information we want in two different tables — Aircraft and Flights — so we need a way to structure the query such that the data for aircraft X is taken from both tables. We do this by selecting data from the tables with an “inner join.”
"select ... from Aircraft INNER JOIN Flights ON (Aircraft.AircraftID=Flights.AircraftID) ..."
Both tables have a column called AircraftID, which is a number the database assigns to any new aircraft that are detected. The same number is written to both tables; it’s a way for the database to know that the data for aircraft 123456 in table A corresponds to the data for the same aircraft in Table B.
We want to select only the aircraft that have been seen today and we want the most recent ones at the top, so we need to include a qualifier in our query:
"...where Flights.EndTime like '%THEDATE% %%' order by Flights.EndTime DESC;"
This returns only those flights that were last seen on %THEDATE%, which is the variable we assigned on the very first line of our batch file. The last half, “order by…” sorts the results in descending order based on the date and time the flights were last seen.
Lastly we need to specify what columns we want returned for our data. There are plenty of columns in the database (you can read more about them here) but we require just a handful, namely: the ModeS code, the country this belongs to, the aircraft’s registration and owners, the flight’s current callsign, the ICAO Type Code for the aircraft and it’s full description type, the operator’s code and lastly the time the flight was last seen.
Now some of those columns have names that aren’t reader-friendly on a website in a table, so as part of our query we’re going to rename those column headers on the fly:
"select Aircraft.ModeS, Aircraft.ModeSCountry as Country, Aircraft.Registration, Aircraft.RegisteredOwners as Owner, Flights.Callsign, Aircraft.ICAOTypeCode as 'ICAO Code', Aircraft.Type, Aircraft.OperatorFlagCode as 'Operator Code', Flights.EndTime as 'Last Seen'..."
The column headers that I’m renaming are the ones followed by as, for example “Flights.EndTime as ‘Last Seen’.” The last part of this line is what outputs the results to the text file:
>> %THECSVFILE%
This is followed by another delay — five seconds this time — to allow the database query to run and the data to be written out. Five seconds is again probably too long but it works:
timeout /t 5 /nobreak
The final nine lines of code are the ones that upload your text file to your website. FTP is used to transfer the file (FTP = File Transfer Protocol) and fortunately FTP is built into Windows. You’ll need to replace some of the text in these lines for it to work correctly:
@echo off
echo user yourusername> ftpcmd.dat
echo yourpassword>> ftpcmd.dat
echo bin>> ftpcmd.dat
echo cd yourdirectory>> ftpcmd.dat
echo put %THECSVFILE%>> ftpcmd.dat
echo quit>> ftpcmd.dat
ftp -n -s:ftpcmd.dat your.ftphost.com
del ftpcmd.dat
Substitute yourusername, yourpassword, yourdirectory and your.ftphost.com with your actual username and password to upload files to your site, the directory to put the file in — for example wp-content/uploads — and the address of the FTP access to the site. This information is written to a temporary file called ftpcmd.dat, which is referenced by the FTP application when it’s run by this line:
ftp -n -s:ftpcmd.dat your.ftphost.com
The last line deletes the temporary file once the upload has completed.
del ftpcmd.dat
To include your text file in a page or post in your WordPress blog, you need to insert a shortcode that is interpreted by the CSV To SortTable plug-in that you installed above. (You did do that, right?) I have mine in a page, not a post, and the shortcode I use looks like the one that follows. (Note: I had to add a space after the opening square bracket and one before the closing square bracket in order for the code to appear here instead of the actual table; you’ll need to remove these spaces when you enter the shortcode in your page or post for the shortcode to work properly.)
The plug-in has some parameters that you can add. I have used the unsortable parameter to render the sort order of my columns static. In other words, you can’t sort them. You can find other parameters on the plug-in’s download page. Information on how to style your columns and rows can be found here.
Scheduling Your Batch File to Run Regularly
Your batch file can be run once by opening a Command Prompt and entering:
cd c:\
db_query.bat
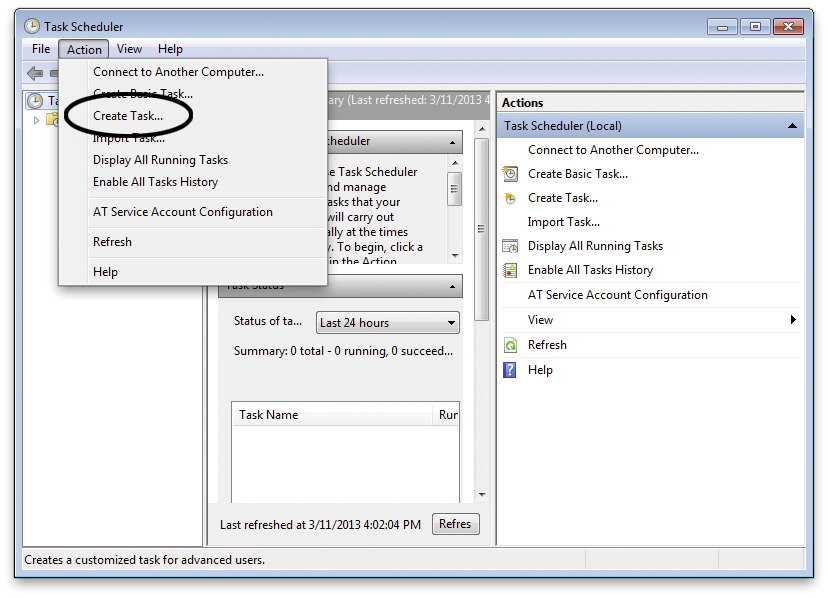
You can use this method to make sure your batch file executes all its code properly and that the FTP upload works. If it does, you may want to have it run at set intervals so that your website has a constantly updating list of flights. You can use Task Scheduler in Windows 7 to do this. You’ll find it in Start > All Programs > Accessories > System Tools. Start by selecting Action > Create task.
Create a new task in Windows 7 Task Scheduler.
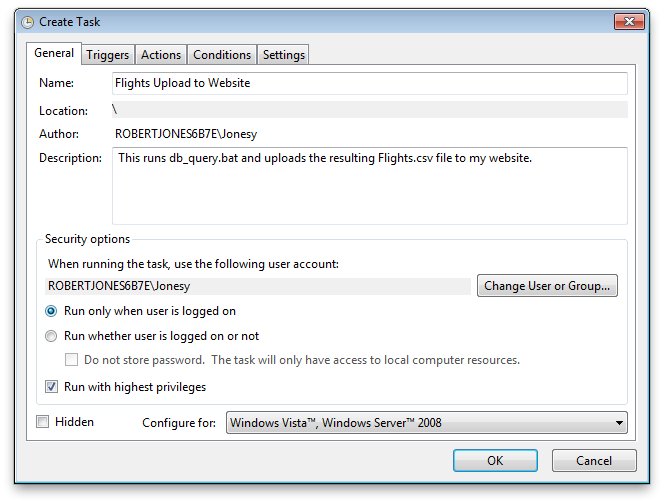
On the General tab, give your task a name and specify that it should run only when you’re logged in.
The General tab in Task Scheduler.
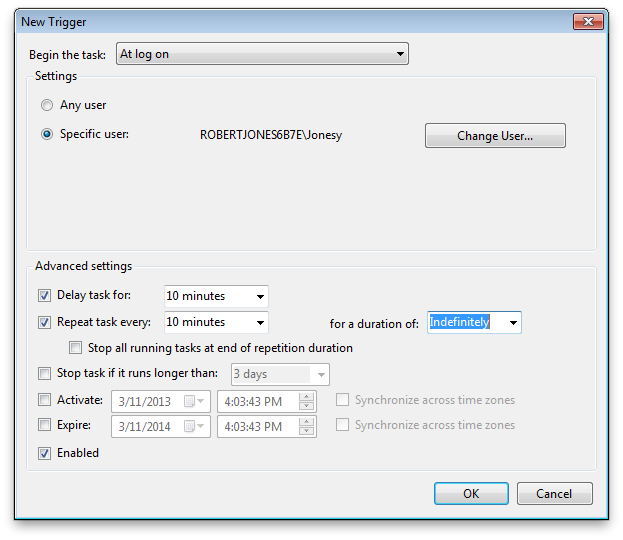
Now go over to the Triggers tab. Here you’ll specify two triggers that start execution of the task. The first trigger is when you login to Windows. I have mine set to a 10 minute delay to give me time to launch all of my other apps. (Note that 10 minutes isn’t in the drop-down list for Delay but you can select 15 minutes and then change the 5 to a 0.) I’ve also set this trigger to repeat the task every 10 minutes for an indefinite amount of time. Don’t forget to Enable the task!
Set a trigger to run the task whenever you login to Windows.
The second trigger will run the task when you create the schedule and whenever you modify this schedule. This one will also be set to repeat every 10 minutes for an indefinite amount of time, but unlike the first trigger this one does not have a 10-minute delay.
The second trigger has no delay.
Finally on the Action tab you specify which program the task should execute whenever it runs. Click Browse and select the batch file you created. Mine is c:\db_query.bat.
Specify the batch file to be run by the Task Scheduler.
And that’s it. Save your task and watch it run immediately…and every 10 minutes after that. Then enjoy sharing your data on the Internet.